Taking imagery of bike lanes in Toronto: 60,000 photos later…
This post originally appeared on the BikeSpace blog.
Imagery Update
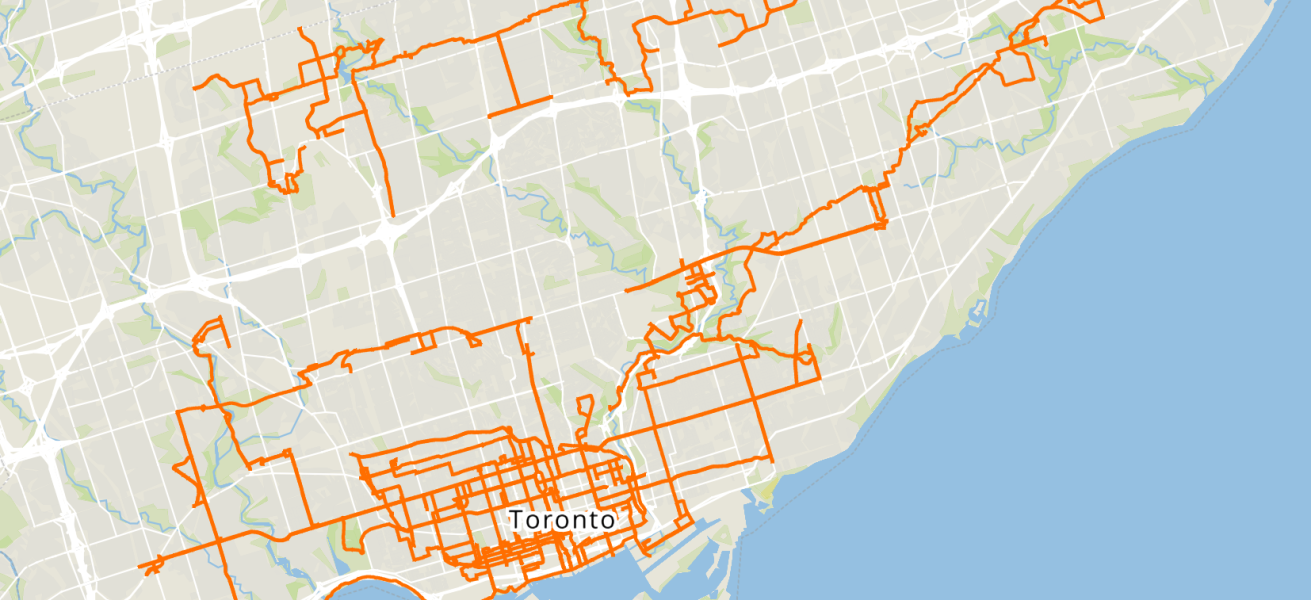
After a summer and fall of taking 360 imagery of bike lanes, I finished capturing street-level imagery of all the protected bike lanes in the City’s dataset. The last segment on November 8 was the final part of the new Harbord St bike lanes E of Grace St.
So far, I’ve captured over 60,000 individual images and nearly 590 km of image sequences. The City last reported in 2024 that they had 104km of protected bike lanes (“cycle tracks” in their parlance), so with the need to capture most of them in both directions, the protected bike lanes are probably around a third of the total captures.
There are still many kilometres of painted bike lanes, sharrow routes, and park trails that need to be captured, but that can be next summer’s project!
Legislation Update
It’s been a busy year! Since the last blog post in May:
- In July, Cycle Toronto won the case to keep the injunction against removing the bike lanes on Bloor, Avenue, and Yonge.
- Then in August, the province appealed it again to the superior court.
- In early October, the province worked with the City to reconfigure a small part of Bloor St W without removing bike lanes (striking a less combative tone than before).
- But only a couple weeks later, introduced new legislation to double down again on banning municipalities from building any bike lane that removes space from vehicles.
Tagging Images for Machine Learning
Being curious about how to use this imagery to detect broken bike parking or to measure bike parking utilization (i.e. how many bikes are locked to a particular rack or post), I did some research into how to tag and classify images to create a training set.
Label Studio seemed very promising, and this is the software used by Panoramax in their own machine learning tutorial. However, it doesn’t have a mode specialized for tagging 360 images, so you still have some distortion based on tagging the “flat” version of the image.
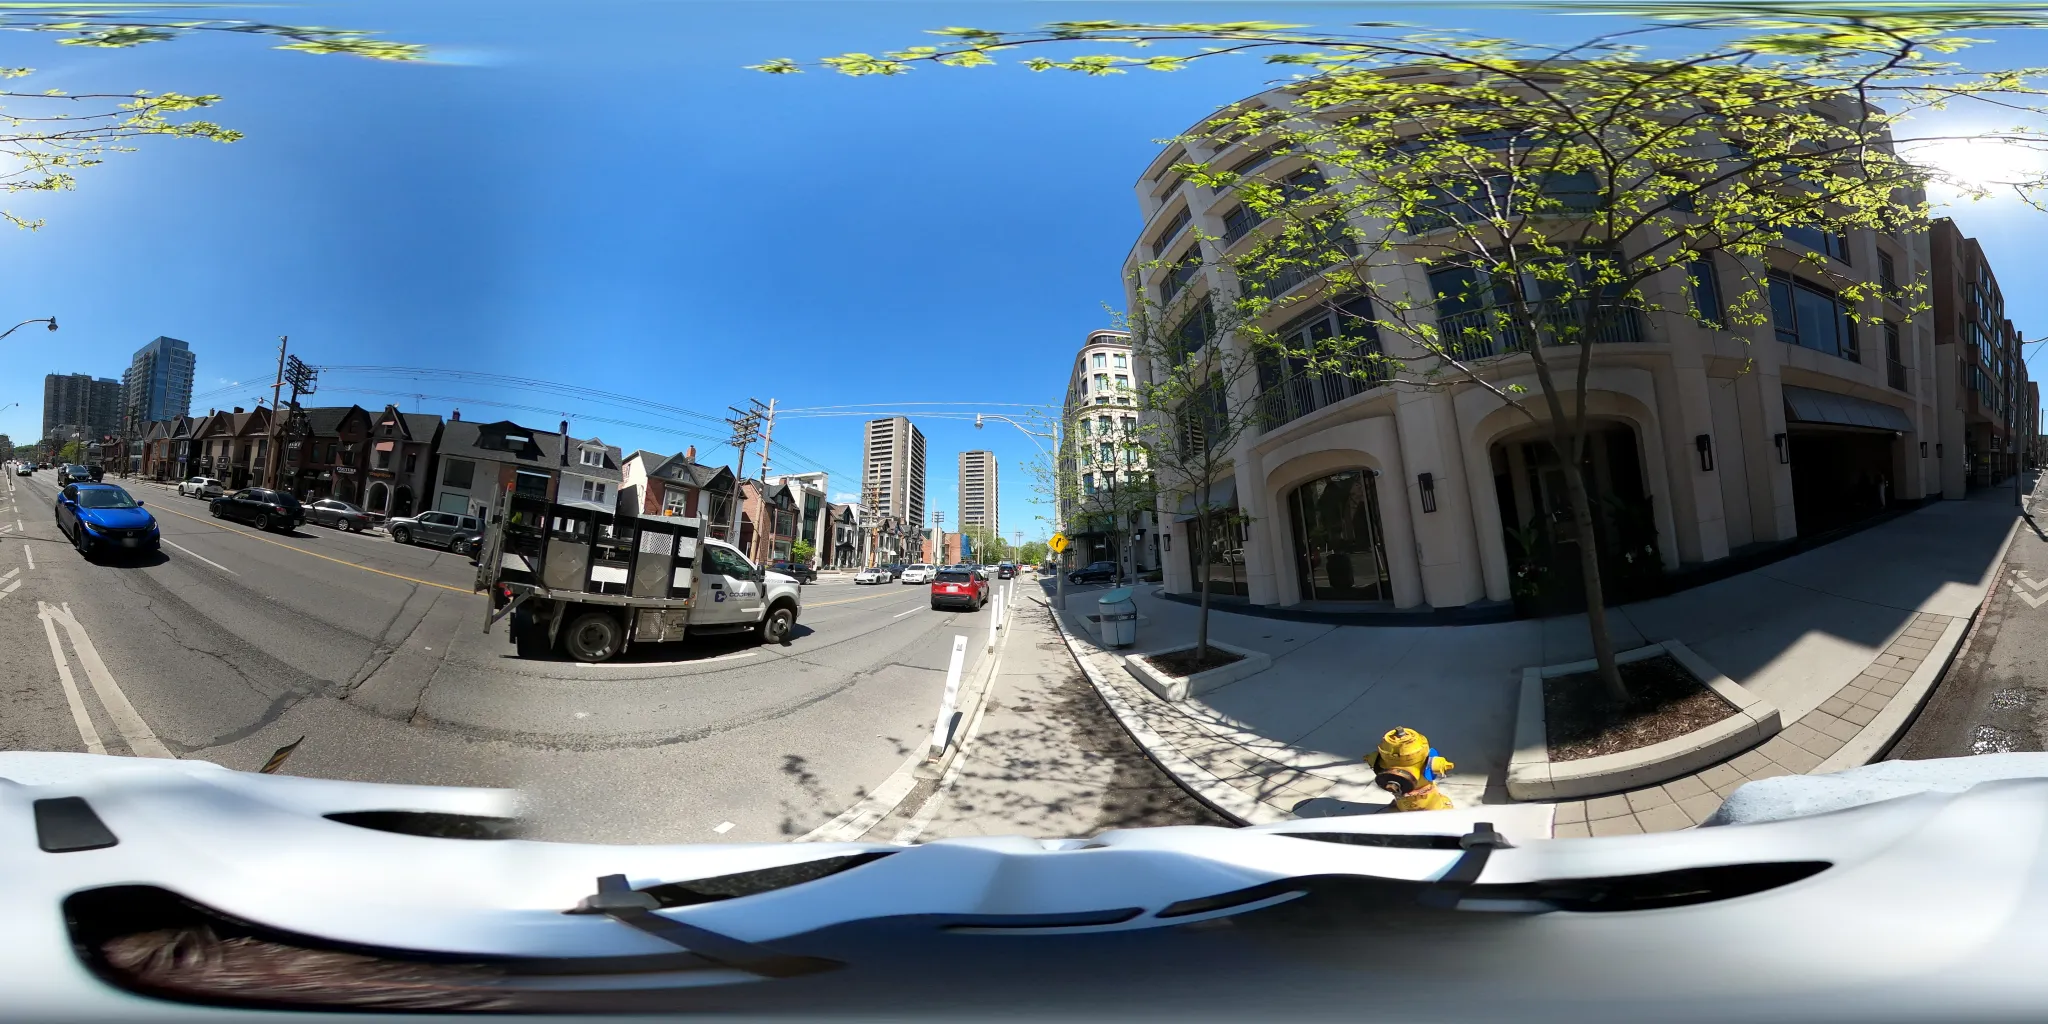
Example of a “flattened” 360 image (the raw file before being loaded in a proper 360 image viewer)
An alternative would be to split the image up, e.g. taking the view from 0, 90, 180, and 270 degrees horizontally (and possibly up and down, though this is less likely to be useful for streetscape features). This would reduce the distortion, potentially allowing for better matches at the cost of having a larger number of images to process and store, at least temporarily. I think what I’m describing would be to generate a cube map from the equirectangular image and then to do training and classification on the cube “facets” that are generated.
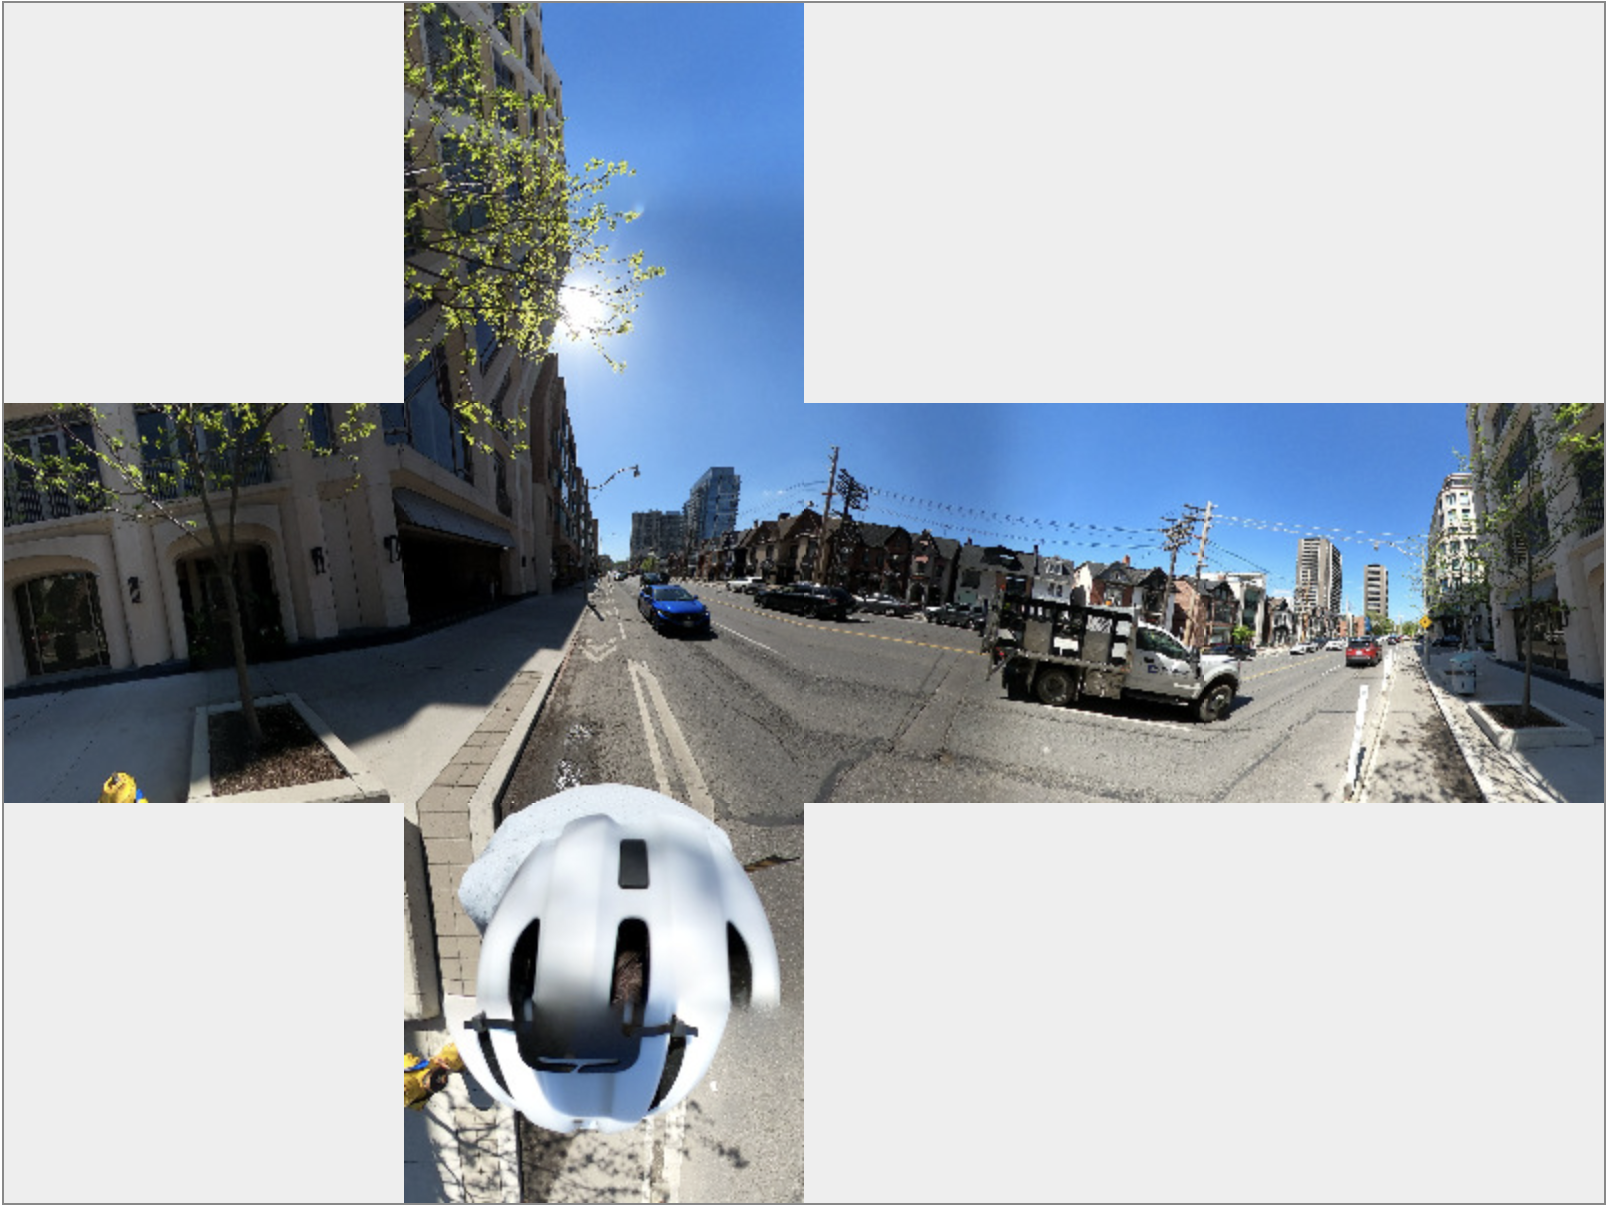
The previous image converted into a cube map of six images from different perspectives of the photo sphere
Panoramax also recently launched a feature where users can add their own tagging onto photos. This opens up a lot of interesting options with a very simple user interface, and their developers have done a fantastic job of making it easy to use.
The selection area does seem to be based on the underlying “flat” photo instead of the photosphere coordinates, so you get the same distortion quirks near and at the edges of the source photo.

Example of tag area selection distortion at the source image boundary
The library that Panoramax uses to display 360 images, Photo Sphere Viewer, appears to have options for selecting coordinates from the photo sphere, so it might be possible to tag based on spherical coordinates instead and convert it into a boundary for the underlying image.
In summary, there are some interesting technical challenges to think through, but the tools that the open source community behind Panoramax are building are really promising and have a lot of potential.